Introduction
Ask ten slot players what makes a game "feel good" and you'll get ten different answers. Some say it's the bonus features. Some say it's the graphics. Some say it's the big wins. But dig into the data — session lengths, return rates, player ratings — and one metric surfaces again and again as the single strongest predictor of perceived enjoyment: how often the player feels like they won something.
Not how much they won. How often.
This is the domain of Hit Frequency and Win Frequency — two related but distinct metrics that together define the rhythm of a slot machine. Get this rhythm right and players stay for hours, return the next day, and recommend your game. Get it wrong — too sparse or too generous — and the game fails: either players burn through their bankroll before the bonus triggers once, or the constant stream of trivial micro-wins creates a monotonous, casino-esque feeling that drives players away in search of something more exciting.
For a slot developer, Hit Frequency and Win Frequency are not just descriptive statistics pulled from a simulation report. They are design instruments — levers that shape the emotional arc of each session, that determine whether your game is positioned as a casual entertainer or a high-stakes thrill ride, and that critically affect your game's performance metrics in an operator's lobby.
This article gives you the complete picture: precise mathematical definitions, the psychological mechanisms behind why these numbers matter, how they interact with RTP and variance, how to calculate them analytically and verify them through simulation, how to engineer specific frequency profiles, and how to avoid the common traps that produce games that look right on paper but feel wrong at the table.
Part I. Definitions and Distinctions
1.1 Hit Frequency — The Broadest Measure
Hit Frequency (HF) is the proportion of spins that produce any non-zero payout — any return to the player, regardless of how small.
Hit Frequency = (Number of spins with any win > 0) / (Total spins)A slot with Hit Frequency = 30% means that, over a long run, three out of every ten spins produce some kind of win. The other seven are dead spins — zero return.
The critical word is "any". A payout of 0.2× the stake (returning one-fifth of what the player bet) counts as a hit by this definition. So does a payout of 5000×. Hit Frequency treats a micro-win and a jackpot identically: they both register as "not zero."
This makes Hit Frequency a blunt instrument. It tells you about the density of winning events but says nothing about their magnitude. Two games can have identical 30% Hit Frequency while delivering completely different experiences:
Game A (HF = 30%):
  80% of wins: 0.2× – 0.5× stake   (net loss, but counts as "win")
  18% of wins: 1× – 10× stake
   2% of wins: 10× – 1000× stake

Game B (HF = 30%):
  20% of wins: 0.2× – 0.5× stake
  60% of wins: 1× – 10× stake
  20% of wins: 10× – 1000× stake
Same Hit Frequency. Radically different player experience. Game A is designed to feel like it wins often while quietly draining the player's bankroll with sub-stake returns. Game B is more honest — fewer wins below stake, more wins that actually add value.
1.2 Win Frequency — The Meaningful Measure
Win Frequency (WF) addresses this problem by applying a threshold: only payouts that return at least the stake (≥ 1× the spin bet) count as wins.
Win Frequency = (Number of spins where payout ≥ total bet) / (Total spins)Some developers use an even stricter definition: payouts that return strictly more than the stake (> 1×), so a break-even spin doesn't count. The convention varies by developer; what matters is that you define it consistently and document it clearly in your PAR Sheet.
Win Frequency is a more honest representation of what players intuitively consider "winning" — a spin where they end up with more money than they started with for that spin.
1.3 The Gap Between HF and WF
The gap HF − WF tells you how many of your "hits" are actually net losses in disguise:
Pseudo-win rate = HF − WFA large pseudo-win rate (say, HF = 35%, WF = 18%, gap = 17%) means that 17% of all spins produce a visual win — complete with win animation and sound effects — while actually losing money for the player. This is a deliberate (and legal) design technique. Research consistently shows that pseudo-wins are processed by the brain similarly to real wins, generating a dopaminergic response despite the net loss.
Some regulators are beginning to scrutinise pseudo-win rates. The UK Gambling Commission, for instance, has discussed restrictions on excessively frequent pseudo-wins as part of their responsible gambling framework. As a developer, you need to know where your game sits on this spectrum.
1.4 Dry Spell Frequency — The Flip Side
Equally important to how often you win is how long you can go without winning. The longest realistic losing streak significantly affects the player's emotional state and bankroll risk.
P(exactly N consecutive losses) = (1 − HF)^N

E(longest losing streak in S spins) ≈ log(S) / log(1/(1−HF)) − 1
For HF = 30%, expected longest streak in 1000 spins:
E(max streak) ≈ log(1000) / log(1/0.7) − 1
             ≈ 6.908 / 0.357 − 1
             ≈ 18.4 spins
So a player making 1000 spins on a 30% HF game should expect to hit a run of about 18–20 consecutive losses at some point in their session. That's roughly 20 seconds of dead spins at a 1-second spin rate — uncomfortable but not catastrophic.
For HF = 15% (high-volatility game):
E(max streak) ≈ log(1000) / log(1/0.85) − 1
             ≈ 6.908 / 0.163 − 1
             ≈ 41.4 spins
Over 40 consecutive losses — a full 40 seconds of dead spins with no visual feedback. For many players, this is the point where frustration crosses into abandonment.
1.5 A Taxonomy of Frequency Metrics
To build a complete picture, here are all the frequency metrics a complete PAR Sheet should report:
Metric | Formula | What It Tells You |
|---|---|---|
Hit Frequency (HF) | Spins with win > 0 / Total | How often any non-zero return occurs |
Win Frequency (WF) | Spins with win ≥ bet / Total | How often the player is net-positive for that spin |
Pseudo-win Rate | HF − WF | How often the player "wins" but loses net |
Dry Spell Rate | 1 − HF | How often a spin produces nothing |
Bonus Trigger Rate | Bonus spins / Total | How often the bonus feature fires |
Big Win Rate | Spins with win ≥ 20× bet / Total | How often a meaningful large win occurs |
Jackpot Rate | Spins with max win / Total | How often the theoretical maximum is hit |
Each of these metrics shapes a different aspect of the player experience, from the moment-to-moment rhythm to the long-term narrative arc of a session.
Part II. The Psychology of Frequency
2.1 Why Frequency Matters More Than Magnitude (For Most Players)
Behavioural economics and gambling psychology offer a consistent finding: loss aversion is asymmetric. The pain of a loss is roughly twice as powerful as the pleasure of an equivalent gain (Kahneman and Tversky's Prospect Theory). For slot players, this translates to:
A session with 30 small wins and 70 losses feels better than a session with 1 large win and 99 losses — even if the total money returned is identical
Frequent small wins provide repeated positive reinforcement that keeps players engaged
Long losing streaks generate anxiety disproportionate to the financial loss involved
This asymmetry is the fundamental reason low-volatility games retain casual players better than high-volatility games, even when the RTP is identical. The high-volatility game is mathematically superior for maximising potential return — but it exposes the player to an emotional experience many find unpleasant.
2.2 Variable Ratio Reinforcement and the Slot Machine
Psychological research, beginning with B.F. Skinner's operant conditioning studies, has established that variable ratio reinforcement — rewards that arrive at unpredictable, variable intervals — produces the highest and most persistent rates of responding. This is precisely the reinforcement schedule that a slot machine delivers.
The critical nuance: the reinforcement must be unpredictable but not too sparse. If the variable ratio is too long (too few rewards per response), the organism (or player) eventually extinguishes — stops responding. A Hit Frequency of 10% means one win every 10 spins on average — 10 seconds of pressing a button with no feedback at a standard spin rate. This approaches the boundary where the variable ratio is too sparse for effective conditioning.
The practical implication for slot design:
Optimal variable ratio for sustained engagement ≈ 1 win per 3–5 spins
This corresponds to HF = 20–33%
Below 20% HF, many players report the game feeling "cold" or "broken." Above 40% HF, the wins become expected — predictable — which reduces the dopaminergic surprise response that makes winning rewarding. The win no longer feels like a win; it feels like a cost-of-doing-business.
2.3 The Win Animation Threshold
Not all "wins" receive the same treatment in the UI. Game designers typically define a win threshold — payouts above this threshold trigger a full win celebration (coins flying, loud sound, flashing lights). Below the threshold, the win is acknowledged quietly or not at all.
A common threshold: the spin bet. Returns below 1× stake get minimal or no animation. Returns of 1× to 5× stake get a modest win display. Returns of 5×+ get the full celebration.
This creates an interesting engineering constraint: Win Frequency (returns ≥ 1× stake) is the threshold for the emotionally meaningful win events that drive engagement. Hit Frequency may be higher due to sub-stake returns, but those don't register emotionally in the same way.
Implication: the metric you should optimise for player experience is Win Frequency, not Hit Frequency. A game with HF = 35% and WF = 12% will feel worse than a game with HF = 28% and WF = 22%, even though the first has higher raw Hit Frequency.
2.4 Session Arc: The Emotional Narrative
Think of a gaming session as a narrative with a beginning, middle, and end. The frequency profile determines the shape of this narrative.
High Win Frequency, Low Max Win (Low Volatility):
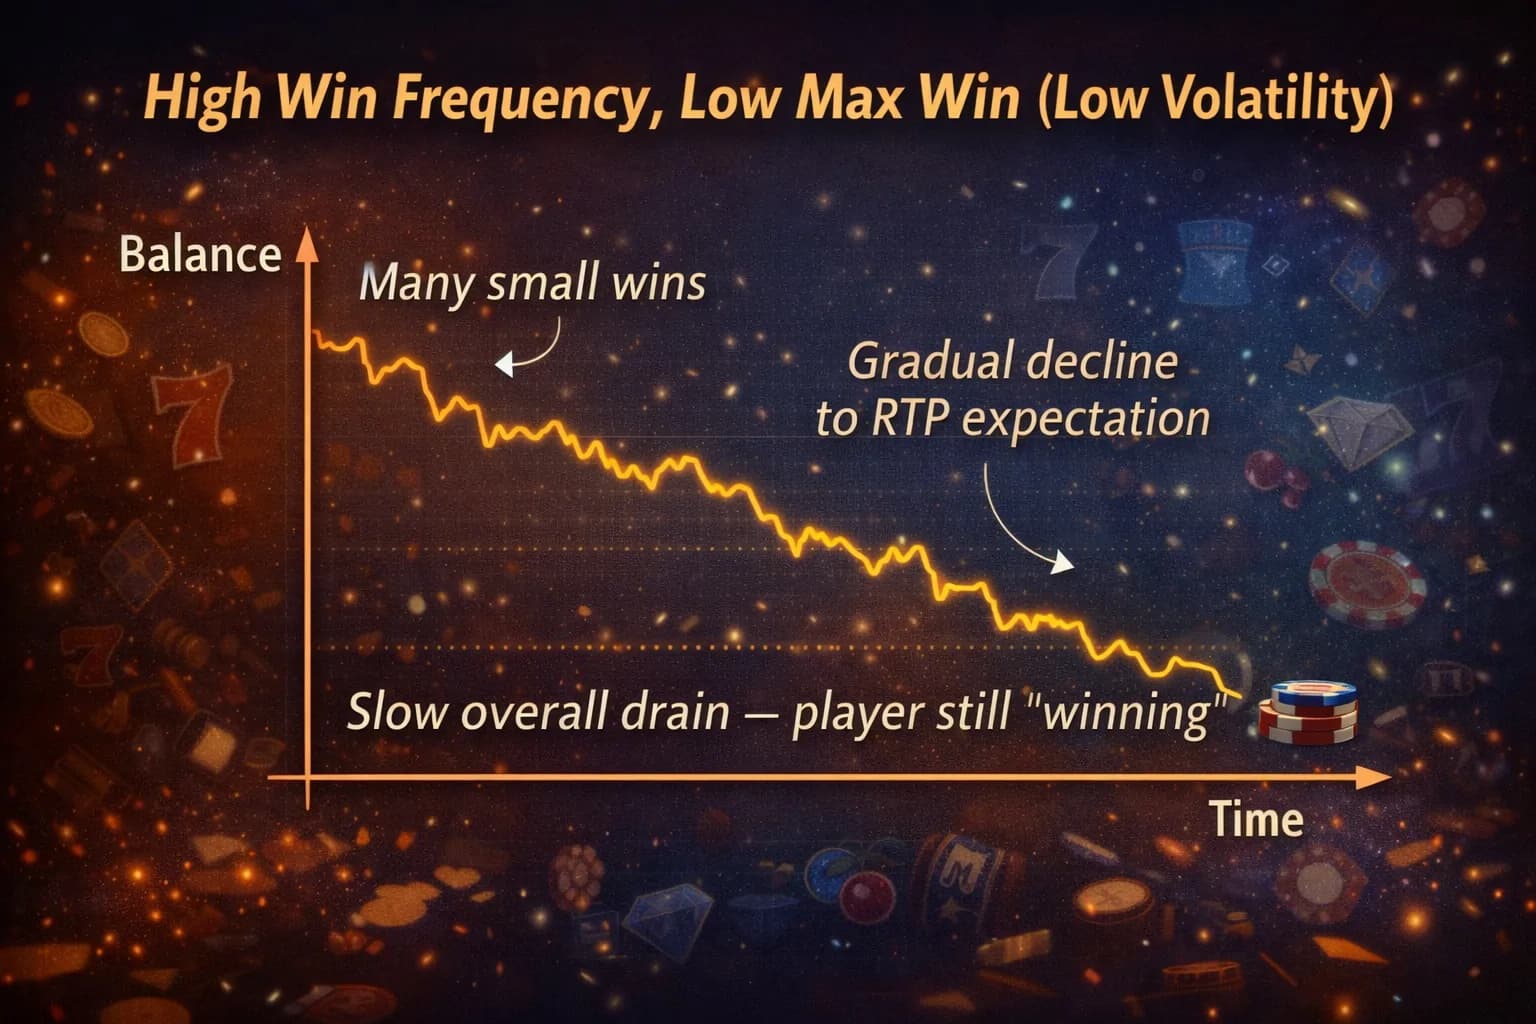
The player feels engaged throughout. No dramatic moments. The session ends because the budget is depleted — slowly and relatively comfortably.
Low Win Frequency, High Max Win (High Volatility):
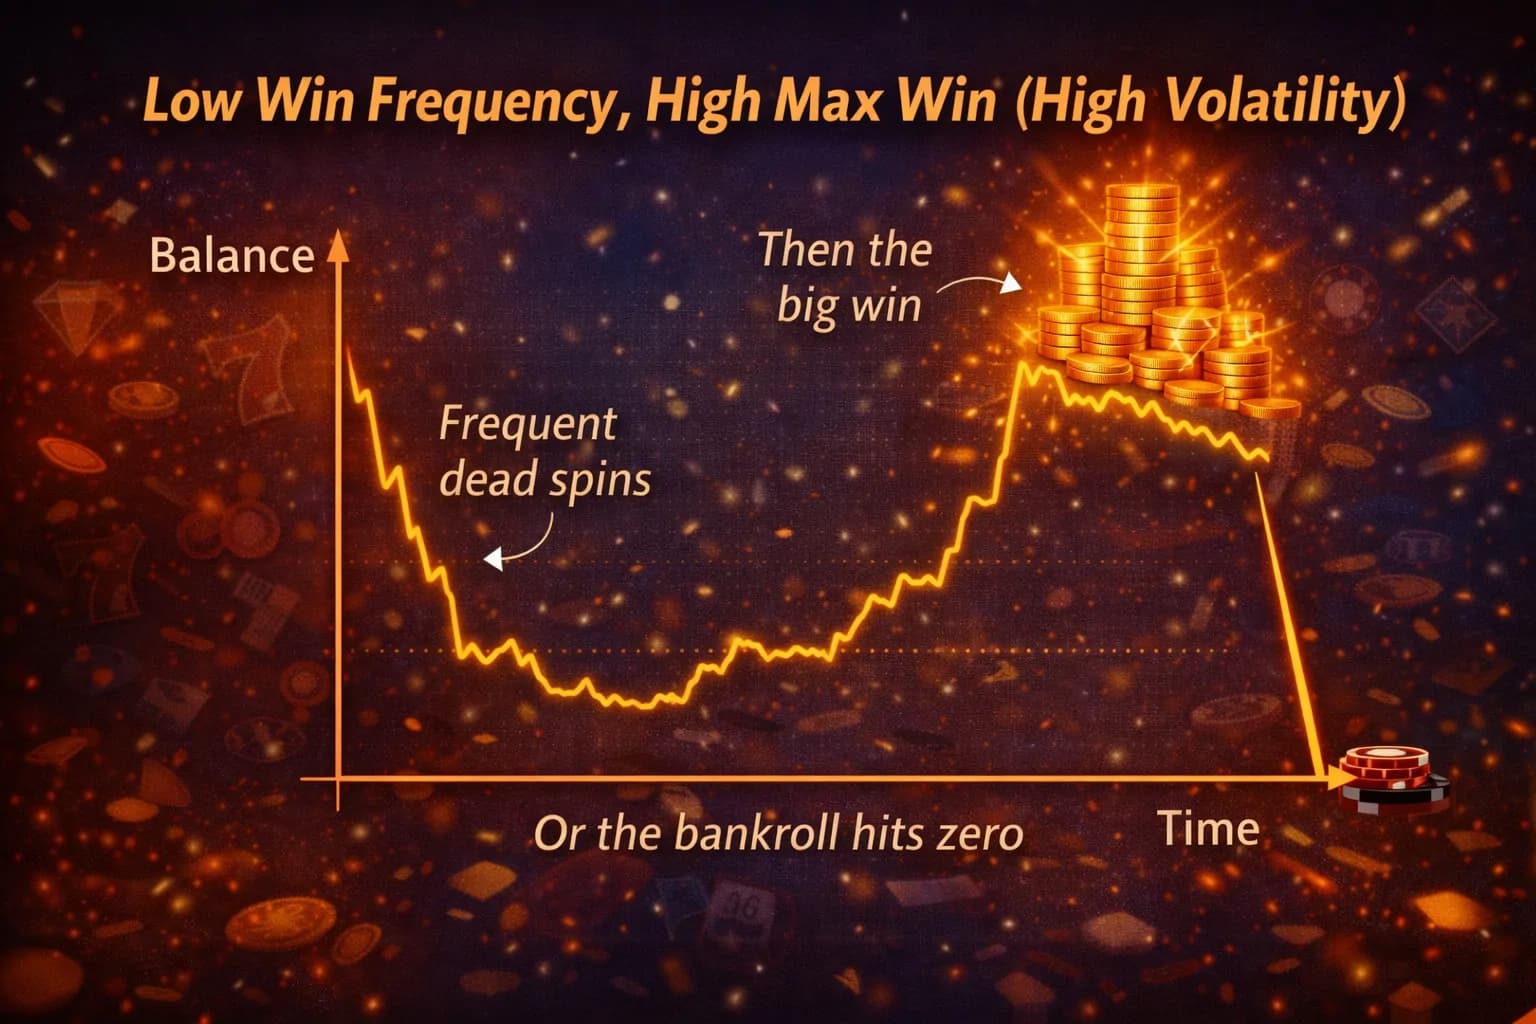
The player either hits a big win and leaves satisfied (or keeps playing) or drains their bankroll through a long sequence of dead spins. The session is emotionally intense — potentially thrilling or frustrating, rarely neutral.
Medium Win Frequency with Bonus Feature (Medium Volatility):
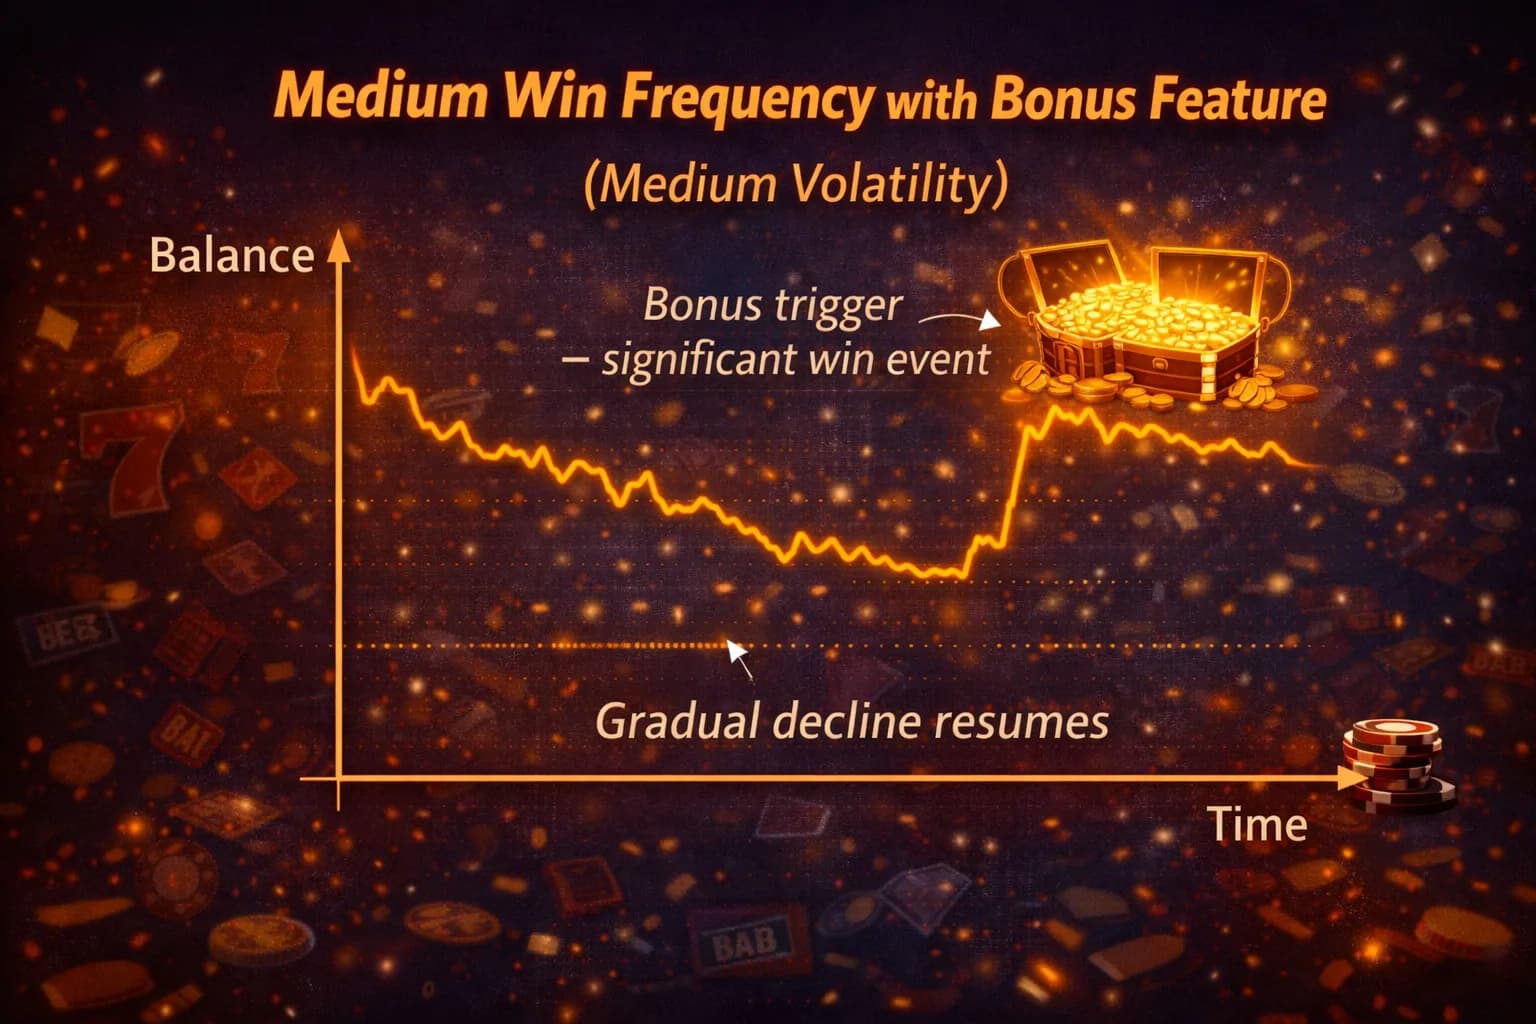
The narrative has a peak — the bonus feature — that the player builds toward. The base game provides enough frequency to sustain engagement between bonus triggers.
This narrative arc is what you're engineering when you set Hit Frequency and Bonus Trigger Rate. The most successful medium-volatility games are built around this structure: comfortable base game frequency, rare but emotionally significant bonus events.
Part III. Mathematical Framework
3.1 Exact Computation of Hit Frequency
For a line-based slot, Hit Frequency is computed as:
P(win on spin) = 1 − P(no win on any line)For a single payline, the probability of no win is:
P(no win on line L) = 1 − Σ_{all winning combos} P(combo on L)For multiple overlapping paylines (the common case), computing the exact joint probability of "at least one line wins" requires inclusion-exclusion across all possible line combinations — computationally expensive for 20+ lines.
The practical approach: full enumeration.
public static (double HitFrequency, double WinFrequency, double PseudoWinRate)
    ComputeFrequencies(ReelStrip[] strips, int[][] paylines,
                       Dictionary<(int sym, int count), decimal> payTable,
                       decimal totalBet)
{
    long totalCombinations = strips.Aggregate(1L, (acc, s) => acc * s.Length);
    long hitCount     = 0;
    long winCount     = 0;
    long pseudoWinCount = 0;

    foreach (var stops in EnumerateAllStops(strips))
    {
        // Build visible grid [col][row]
        var grid = BuildGrid(strips, stops);

        // Evaluate all paylines
        decimal spinWin = 0;
        foreach (var payline in paylines)
        {
            var (symbolId, matchCount) = EvaluateLine(grid, payline);
            if (matchCount >= 3 && payTable.TryGetValue((symbolId, matchCount), out var payout))
                spinWin += payout;
        }

        if (spinWin > 0)
        {
            hitCount++;
            if (spinWin >= totalBet) winCount++;
            else pseudoWinCount++;
        }
    }

    double hf          = (double)hitCount       / totalCombinations;
    double wf          = (double)winCount        / totalCombinations;
    double pseudoWinRate = (double)pseudoWinCount / totalCombinations;

    return (hf, wf, pseudoWinRate);
}
3.2 Computing Win Size Distribution
Beyond aggregate frequencies, you need the full distribution of win sizes. This is what determines both the perceived volatility and the emotional impact of wins.
public record WinBucket(decimal MinMultiple, decimal MaxMultiple, string Label);

public static Dictionary<WinBucket, double> ComputeWinDistribution(
    ReelStrip[] strips,
    int[][]     paylines,
    Dictionary<(int sym, int count), decimal> payTable,
    decimal     totalBet)
{
    // Define buckets by win-to-bet ratio
    var buckets = new[]
    {
        new WinBucket(0.01m, 0.5m,   "Sub-stake (0.01–0.5×)"),
        new WinBucket(0.5m,  1.0m,   "Near-even (0.5–1×)"),
        new WinBucket(1.0m,  2.0m,   "1–2× (break-even+)"),
        new WinBucket(2.0m,  5.0m,   "2–5× (small win)"),
        new WinBucket(5.0m,  20.0m,  "5–20× (medium win)"),
        new WinBucket(20.0m, 100.0m, "20–100× (big win)"),
        new WinBucket(100.0m,500.0m, "100–500× (huge win)"),
        new WinBucket(500.0m,decimal.MaxValue, "500×+ (epic win)"),
    };

    long totalCombinations = strips.Aggregate(1L, (acc, s) => acc * s.Length);
    var  counts            = new Dictionary<WinBucket, long>();
    foreach (var b in buckets) counts[b] = 0;

    foreach (var stops in EnumerateAllStops(strips))
    {
        var grid    = BuildGrid(strips, stops);
        decimal spinWin = 0;

        foreach (var payline in paylines)
        {
            var (symbolId, matchCount) = EvaluateLine(grid, payline);
            if (matchCount >= 3 && payTable.TryGetValue((symbolId, matchCount), out var payout))
                spinWin += payout;
        }

        if (spinWin <= 0) continue;

        decimal multiple = spinWin / totalBet;
        var bucket = buckets.FirstOrDefault(b => multiple >= b.MinMultiple
                                              && multiple < b.MaxMultiple);
        if (bucket != null)
            counts[bucket]++;
    }

    return counts.ToDictionary(
        kv => kv.Key,
        kv => (double)kv.Value / totalCombinations
    );
}
3.3 The Dry Spell Distribution
Beyond the expected longest losing streak, you need the full distribution of losing streak lengths — critical for understanding the tail risk of the player experience.
public static Dictionary<int, double> ComputeDrySpellDistribution(
    double hitFrequency,
    int    maxStreakLength = 100)
{
    double p     = 1.0 - hitFrequency;  // P(single loss)
    var    dist  = new Dictionary<int, double>();

    // P(exactly N consecutive losses) at any given starting point
    // This is the geometric distribution
    for (int n = 1; n <= maxStreakLength; n++)
    {
        // P(streak of exactly N) = P(loss)^N × P(win or start) × P(win or end)
        // Simplified: for streak starting mid-sequence
        double pExact = Math.Pow(p, n) * hitFrequency;  // streak of N then a win
        dist[n] = pExact;
    }

    return dist;
}

/// <summary>
/// Computes the probability of experiencing at least one dry spell of
/// length >= N over a session of S spins.
/// </summary>
public static double ProbabilityOfDrySpellInSession(
    double hitFrequency, int streakLength, int sessionSpins)
{
    // P(any single starting position begins a streak of >= N)
    double pStreakAtPosition = Math.Pow(1.0 - hitFrequency, streakLength);

    // Approximate probability of at least one such streak in S spins
    // using 1 - (1 - p)^S (independent approximation — slight overcount)
    int    positions = Math.Max(1, sessionSpins - streakLength + 1);
    double pNone     = Math.Pow(1.0 - pStreakAtPosition, positions);
    return 1.0 - pNone;
}

// Example usage:
// P(at least one 20-loss streak in a 500-spin session at HF=30%):
// ProbabilityOfDrySpellInSession(0.30, 20, 500)
// = 1 - (1 - 0.7^20)^481
// = 1 - (1 - 0.000798)^481
// ≈ 1 - 0.682 = 31.8%
The practical implication: in a 500-spin session with 30% Hit Frequency, about one in three players will experience a streak of 20+ consecutive losses. At 40 consecutive losses, roughly 3–5% of players will hit that. These are the players who leave a one-star review saying "this game never wins."
3.4 Modelling the Expected Session Arc
Given Hit Frequency, RTP, and starting balance, we can model the statistical distribution of session outcomes:
public record SessionModel(
    double HitFrequency,
    double Rtp,
    double Variance,
    decimal StartingBalance,
    decimal BetPerSpin
);

public record SessionStatistics(
    double MeanSpinsToRuin,       // Average spins before balance hits zero
    double Percentile10Spins,     // 10th percentile session length (short sessions)
    double Percentile50Spins,     // Median session length
    double Percentile90Spins,     // 90th percentile (long sessions)
    double ProbabilityDoubleUp,   // P(balance doubles before hitting zero)
    double ExpectedWinningSpins,  // E(spins with win ≥ bet) per 100 spins
    double ExpectedDrySpells      // E(dry spells ≥ 10 consecutive losses) per 100 spins
);

public static SessionStatistics ComputeSessionStatistics(
    SessionModel model,
    int          simulations = 100_000)
{
    var  spinsToRuin      = new List<int>(simulations);
    int  doubleUps        = 0;
    long totalWinSpins    = 0;
    long totalDrySpells   = 0;

    for (int sim = 0; sim < simulations; sim++)
    {
        decimal balance      = model.StartingBalance;
        decimal peakBalance  = balance;
        int     spins        = 0;
        int     consecutiveLosses = 0;

        while (balance >= model.BetPerSpin && spins < 100_000)
        {
            spins++;
            balance -= model.BetPerSpin;  // deduct bet

            // Simulate spin outcome using normal approximation
            // (exact simulation would use the full combination enumeration)
            decimal spinWin = SimulateSpin(model);
            balance += spinWin;

            if (spinWin >= model.BetPerSpin)
            {
                totalWinSpins++;
                if (consecutiveLosses >= 10) totalDrySpells++;
                consecutiveLosses = 0;
            }
            else
            {
                consecutiveLosses++;
            }

            if (balance > peakBalance) peakBalance = balance;
        }

        spinsToRuin.Add(spins);
        if (peakBalance >= model.StartingBalance * 2) doubleUps++;
    }

    spinsToRuin.Sort();
    return new SessionStatistics(
        MeanSpinsToRuin:      spinsToRuin.Average(),
        Percentile10Spins:    spinsToRuin[(int)(simulations * 0.10)],
        Percentile50Spins:    spinsToRuin[(int)(simulations * 0.50)],
        Percentile90Spins:    spinsToRuin[(int)(simulations * 0.90)],
        ProbabilityDoubleUp:  (double)doubleUps / simulations,
        ExpectedWinningSpins: (double)totalWinSpins / simulations / 100,
        ExpectedDrySpells:    (double)totalDrySpells / simulations / 100
    );
}

private static decimal SimulateSpin(SessionModel model)
{
    // Normal approximation for quick session simulation
    // For exact results, use full combination enumeration
    double u    = RandomNumberGenerator.GetInt32(1_000_000) / 1_000_000.0;
    double mean = (double)model.BetPerSpin * model.Rtp;
    double sd   = Math.Sqrt(model.Variance) * (double)model.BetPerSpin;

    // Box-Muller transform for normal deviate
    double u2    = RandomNumberGenerator.GetInt32(1_000_000) / 1_000_000.0 + 1e-10;
    double z     = Math.Sqrt(-2.0 * Math.Log(u)) * Math.Cos(2.0 * Math.PI * u2);
    double win   = mean + sd * z;

    return Math.Max(0, (decimal)win);
}
Part IV. Frequency Profiles by Game Type
4.1 The Frequency Matrix
Different game types occupy different positions in the Hit Frequency × Max Win space. Understanding where your game sits — and where it should sit for its target audience — is a key design decision.
High HF
(40%+)  │  Casual/Fruit games      │  Bonus buy mega-frequent
        │  Starburst-style         │  (rare, usually bad design)
        │  Retro 3-reel            │
        │                          │
        ├──────────────────────────┤
        │                          │
(25-40%)│  Book of Dead            │  Gonzo's Quest
        │  Reactoonz (base)        │  Sweet Bonanza
        │  Razor Shark             │  Cluster pays mid-vol
        │                          │
        ├──────────────────────────┤
        │                          │
(15-25%)│  Dead or Alive           │  Tombstone RIP
        │  Money Train 2           │  Wanted Dead or a Wild
        │  High-vol books          │  Mental (Nolimit)
        │                          │
Low HF  │                          │
(<15%)  │  Very high vol base      │  Extreme volatility
        │  games with Bonus Buy    │  50k+ max win titles
        │                          │
        └──────────────────────────┘
         Low Max Win              High Max Win
         (<2000×)                 (>10000×)
4.2 Benchmark Values by Volatility Class
Based on analysis of hundreds of certified slot titles:
Volatility Class | Hit Frequency | Win Frequency | Pseudo-win Rate | Bonus Trigger | Typical Max Win |
|---|---|---|---|---|---|
Very Low | 40–55% | 30–45% | 5–15% | 1 in 50–80 | < 500× |
Low | 33–40% | 25–33% | 8–15% | 1 in 80–120 | 500–2000× |
Medium | 25–33% | 18–25% | 7–12% | 1 in 120–175 | 2000–5000× |
Medium-High | 20–28% | 13–20% | 7–10% | 1 in 150–250 | 5000–10000× |
High | 15–22% | 8–15% | 7–10% | 1 in 200–350 | 10000–25000× |
Very High | 10–18% | 4–10% | 6–10% | 1 in 300–500 | 25000×+ |
Note that the pseudo-win rate (HF − WF) stays relatively stable across volatility classes at 7–12%. This is not coincidental — it represents a design floor of emotional engagement through sub-stake wins, maintained even in high-volatility games to prevent the base game from feeling completely dead between bonus triggers.
4.3 The Bonus Trigger Rate and Its Role in Session Pacing
The Bonus Trigger Rate (BTR) is technically a frequency metric, but its psychological function is distinct from Hit Frequency. While HF drives moment-to-moment engagement, BTR drives the session-level narrative.
BTR = P(bonus triggers on any given spin)
    = P(3+ Scatters visible anywhere on grid)
The optimal BTR depends heavily on the game's bonus EV:
BTR × EV(bonus) = RTP_bonus contribution

For RTP_bonus = 38% and EV(bonus) = 55×:
BTR = 0.38 / 55 ≈ 0.0069 → 1 in 145 spins ✓
The player's subjective experience of waiting for a bonus:
E(spins between bonuses)  = 1 / BTR

At BTR = 1/80:   Average 80 spins between bonuses ≈ 80 seconds
At BTR = 1/145:  Average 145 spins between bonuses ≈ 2.4 minutes
At BTR = 1/300:  Average 300 spins between bonuses ≈ 5 minutes
At BTR = 1/500:  Average 500 spins between bonuses ≈ 8–9 minutes
Two minutes between bonus triggers is comfortable. Eight minutes feels interminable for most players, especially if the base game has low Hit Frequency and offers little entertainment in between.
This creates the key trade-off in high-volatility design: you can have a very rare bonus with very high EV, or a more frequent bonus with moderate EV, at the same total RTP contribution. The choice of which determines whether your game appeals to patient "bonus hunters" or impatient recreational players.
Part V. Engineering Specific Frequency Profiles
5.1 From Target to Implementation: The Design Funnel
Setting frequency targets and then engineering them into the reel strip requires working through a design funnel:
1. Define volatility class → sets approximate HF and WF ranges
            ↓
2. Set target HF and WF explicitly (not just a range)
            ↓
3. Allocate RTP budget between base game and bonus
            ↓
4. Design pay table: ratio of low/mid/high payouts determines HF/WF gap
            ↓
5. Design reel strips: symbol weights determine combination probabilities
            ↓
6. Compute exact HF and WF via full enumeration
            ↓
7. Iterate steps 4–6 until within tolerance of targets
The key insight: HF and WF are primarily controlled at the pay table design stage, not the reel strip stage. Reel strips control the relative probabilities of combinations; the pay table determines which of those combinations count as wins and how large they are.
5.2 Pay Table Design for Hit Frequency
The Hit Frequency is approximately:
HF ≈ Σ_{all symbols S} Σ_{k=3}^{5} P(k-of-a-kind of S on at least one payline)
   + P(Wild-only combinations)
   − P(overlap corrections for multi-line wins)  [small, often neglected]
To increase Hit Frequency without increasing RTP:
Add small payouts for 2-of-a-kind (if game rules allow)
Increase the weight of low-paying symbols
Add "any bar" type combinations (mixed low symbols pay something)
Reduce payout of 3-of-a-kind low symbols while increasing their weight
To increase Win Frequency (WF specifically, without raising HF much):
Reduce or eliminate sub-stake payouts (the 0.2×, 0.5× categories)
Increase the payout floor for 3-of-a-kind combinations to ≥ 1× stake per line
Add Wild combinations that pay meaningful amounts for 3/4 in a row
5.3 Implementing a Target Hit Frequency Constraint
Adding Hit Frequency as an explicit constraint in the reel weight solver:
/// <summary>
/// Extended solver configuration with explicit frequency targets.
/// </summary>
public record ExtendedSolverConfig(
    double TargetRtp,
    double RtpTolerance,
    double TargetHitFrequency,
    double HitFrequencyTolerance,
    double TargetWinFrequency,
    double WinFrequencyTolerance,
    double TargetVariance,
    double VarianceTolerance,
    double TargetBonusTriggerRate,
    double BonusTriggerTolerance,
    int    MaxIterations = 1000
);

public sealed class FrequencyAwareRtpCalculator
{
    private readonly GameConfig _config;

    public FullFrequencyResult ComputeAll(
        WeightMatrix weights,
        int[][]      paylines,
        decimal      totalBetPerSpin)
    {
        long   cycle           = ComputeCycle(weights);
        double totalRtp        = 0;
        double sumXSquared     = 0;
        long   hitCount        = 0;
        long   winCount        = 0;
        long   bonusTrigger    = 0;
        var    winBuckets      = InitialiseBuckets();

        // Full enumeration over all reel stop combinations
        foreach (var stops in EnumerateAllStops(weights))
        {
            var grid    = BuildGrid(stops, weights, _config);
            decimal win = EvaluateAllLines(grid, paylines, _config.PayTable);

            // Scatter count for bonus trigger
            int scatters = CountScatters(grid, _config.ScatterSymbolId);
            if (scatters >= _config.BonusTriggerScatterCount)
                bonusTrigger++;

            if (win > 0)
            {
                hitCount++;
                decimal multiple = win / totalBetPerSpin;
                if (multiple >= 1.0m) winCount++;
                ClassifyIntoBucket(winBuckets, multiple);
            }

            totalRtp    += (double)(win / totalBetPerSpin);
            sumXSquared += (double)((win / totalBetPerSpin) * (win / totalBetPerSpin));
        }

        double rtp          = totalRtp     / cycle;
        double hitFreq      = (double)hitCount      / cycle;
        double winFreq      = (double)winCount       / cycle;
        double bonusTrigRate = (double)bonusTrigger  / cycle;
        double variance     = sumXSquared / cycle - rtp * rtp;

        return new FullFrequencyResult(
            Rtp:              rtp,
            HitFrequency:     hitFreq,
            WinFrequency:     winFreq,
            PseudoWinRate:    hitFreq - winFreq,
            DrySpellRate:     1.0 - hitFreq,
            BonusTriggerRate: bonusTrigRate,
            Variance:         variance,
            StdDev:           Math.Sqrt(variance),
            WinDistribution:  winBuckets
        );
    }

    private Dictionary<string, long> InitialiseBuckets() => new()
    {
        ["0.01-0.5×"]   = 0,
        ["0.5-1.0×"]    = 0,
        ["1-2×"]        = 0,
        ["2-5×"]        = 0,
        ["5-20×"]       = 0,
        ["20-100×"]     = 0,
        ["100-500×"]    = 0,
        ["500×+"]       = 0,
    };

    private void ClassifyIntoBucket(Dictionary<string, long> buckets, decimal multiple)
    {
        string key = multiple switch
        {
            < 0.5m    => "0.01-0.5×",
            < 1.0m    => "0.5-1.0×",
            < 2.0m    => "1-2×",
            < 5.0m    => "2-5×",
            < 20.0m   => "5-20×",
            < 100.0m  => "20-100×",
            < 500.0m  => "100-500×",
            _          => "500×+",
        };
        buckets[key]++;
    }
}

public record FullFrequencyResult(
    double Rtp,
    double HitFrequency,
    double WinFrequency,
    double PseudoWinRate,
    double DrySpellRate,
    double BonusTriggerRate,
    double Variance,
    double StdDev,
    Dictionary<string, long> WinDistribution
)
{
    public void PrintReport(long cycle)
    {
        Console.WriteLine("═══════════════════════════════════════════════");
        Console.WriteLine("  FULL FREQUENCY ANALYSIS REPORT");
        Console.WriteLine("═══════════════════════════════════════════════");
        Console.WriteLine($"  Cycle (total combinations): {cycle:N0}");
        Console.WriteLine();
        Console.WriteLine($"  RTP:                {Rtp * 100:F4}%");
        Console.WriteLine($"  Variance:           {Variance:F2}");
        Console.WriteLine($"  Std Dev:            {StdDev:F2}× bet");
        Console.WriteLine();
        Console.WriteLine($"  Hit Frequency:      {HitFrequency * 100:F2}%");
        Console.WriteLine($"    → 1 win every     {1.0 / HitFrequency:F1} spins");
        Console.WriteLine($"  Win Frequency:      {WinFrequency * 100:F2}%");
        Console.WriteLine($"    → 1 net+ win every {1.0 / WinFrequency:F1} spins");
        Console.WriteLine($"  Pseudo-win Rate:    {PseudoWinRate * 100:F2}%");
        Console.WriteLine($"  Dry Spell Rate:     {DrySpellRate * 100:F2}%");
        Console.WriteLine($"  Bonus Trigger Rate: {BonusTriggerRate * 100:F4}%");
        Console.WriteLine($"    → 1 bonus every   {1.0 / BonusTriggerRate:F0} spins");
        Console.WriteLine();
        Console.WriteLine("  Win Distribution (% of all spins):");
        foreach (var (bucket, count) in WinDistribution)
        {
            double pct = (double)count / cycle * 100;
            string bar = new string('█', Math.Max(1, (int)(pct * 40)));
            Console.WriteLine($"  {bucket,-12}: {pct,6:F3}%  {bar}");
        }
        Console.WriteLine("═══════════════════════════════════════════════");
    }
}
5.4 The Win Frequency Engineering Toolkit
Technique 1: The 3-of-a-kind payout floor
Set the minimum 3-of-a-kind payout for the lowest symbol to exactly 1× the line bet. This ensures every 3-symbol combination that lands — even the cheapest one — registers as a Win (not a pseudo-win).
Line bet = 0.05 (€1 bet / 20 lines)
Minimum payout for Jack 3× = 0.05 = 1 line bet = 1× line bet multiplier
→ Player bet €1, spin pays €0.05 on that line... still a pseudo-win overall
Wait — even with a 1× line bet payout, if only one of 20 lines wins, the player receives 1/20th of their total bet. This is why Win Frequency must be computed against total bet, not line bet.
For a 20-line game, a single 3-of-a-kind combo paying 1× line bet returns only 5% of the total spin bet. True Win Frequency requires wins that collectively return ≥ 100% of total bet.
Technique 2: Simultaneous multi-line wins
The way to drive Win Frequency up without changing individual line payouts is to engineer situations where multiple lines win simultaneously. This is controlled by the physical arrangement of symbols on the reel strips.
If high-hit-frequency symbols (Queen, Jack) are vertically clustered (appearing consecutively on the strip), a single stop position will show them across multiple rows, causing multiple simultaneous line wins. This "multiplies" the effective payout without changing any individual combination probability.
Technique 3: The Wild line coverage multiplier
Wild symbols on the middle reel (row 1) participate in the middle payline and in diagonal paylines simultaneously. A single Wild on position [2][1] (reel 3, middle row) can contribute to multiple paylines at once. This naturally amplifies Win Frequency when Wild lands, without requiring any change to the base win rate.
Part VI. Frequency Metrics in the PAR Sheet
6.1 What the PAR Sheet Must Report
The PAR Sheet section on Hit Frequency should contain:
HIT FREQUENCY ANALYSIS
═══════════════════════════════════════════════════════
Base Game Hit Frequency:         30.41%
  (any non-zero payout)          1 win per 3.3 spins

Win Frequency (≥ total bet):     22.14%
  (payout ≥ total spin bet)      1 net+ win per 4.5 spins

Pseudo-win Rate:                  8.27%
  (0 < payout < total bet)

Dry Spell Rate:                  69.59%
  (zero payout)

Win Size Distribution (% of all spins):
  0.01× – 0.50× of bet:          5.12%
  0.50× – 1.00× of bet:          3.15%
  1.00× – 2.00× of bet:          9.83%
  2.00× – 5.00× of bet:          8.21%
  5.00× – 20.0× of bet:          3.44%
  20.0× – 100× of bet:           0.59%
  100×  – 500× of bet:           0.062%
  500×  – max win:               0.0047%

Bonus Trigger Frequency:         0.6893%
  (3+ Scatter visible)           1 bonus per 145 spins

Estimated session statistics (1000 spins, starting balance = 100× bet):
  P(session length ≥ 500 spins): 72.4%
  P(session length ≥ 1000 spins): 41.8%
  P(balance doubles before ruin): 18.3%
  Expected longest dry spell:     ~19 consecutive losses
  P(dry spell ≥ 30 consecutive):  12.4%
6.2 Certification Lab Expectations
GLI and BMM don't typically mandate specific Hit Frequency values, but they do:
Verify the reported HF matches the actual game implementation — they run simulations and compare
Check for misleading HF claims in marketing — if you advertise "wins on over 30% of spins," that must be verified
Flag unusual patterns — a Hit Frequency above 50% on a non-trivial slot, or Pseudo-win Rate above 20%, may prompt additional questions
Require Win Distribution data in some jurisdictions — the Netherlands KSA, for example, has requirements around the proportion of outcomes that are net wins vs net losses
The Dutch "Net Win Requirement" (introduced as part of KSA's regulatory framework) effectively mandates a minimum Win Frequency — the proportion of "win" outcomes that are actually net wins must be prominent in player-facing information. Designing for the Dutch market means tracking WF explicitly as a first-class metric.
Part VII. Common Mistakes and Misconceptions
Mistake 1: Optimising Hit Frequency Instead of Win Frequency
// Designer goal: "players should feel like they win often"
// Incorrect implementation: maximise Hit Frequency
// Result: HF = 42%, WF = 14% (28% pseudo-win rate)
// Player experience: constantly "winning" but balance drains fast
// → Negative reviews, accusations of rigged game

// Correct implementation: maximise Win Frequency
// Target: HF = 30%, WF = 22% (8% pseudo-win rate)
// Player experience: wins feel meaningful, balance drains at expected rate
// → Better perceived fairness
Mistake 2: Treating Hit Frequency as Constant Across Bet Levels
Hit Frequency does not change with bet size — it's a mathematical property of the reel configuration. However, Win Frequency does change with bet size if the game has different line counts at different bet levels.
A game where lower bets play fewer active lines has a lower Hit Frequency (fewer lines = fewer winning combinations checked). If the PAR Sheet reports HF at max bet and the operator applies it to min bet, the numbers won't match player experience.
Always report HF and WF at the specific bet configuration they were calculated for. In multi-bet, multi-line configurations, calculate separately for each.
Mistake 3: Ignoring Simultaneous Multi-line Win Correlation
Computing P(at least one line wins) by summing individual line probabilities double-counts outcomes where multiple lines win simultaneously. The correct calculation:
P(at least one win) = 1 - P(all lines lose)

NOT:

P(at least one win) = Σ P(line i wins)  ← overcounts multi-win spins
This can cause reported HF to be overstated by 3–8% relative to actual simulation results for a 20-line slot. Full enumeration (not formula-based approximation) is the only way to get the exact answer.
Mistake 4: Using Hit Frequency as a Marketing Tool Without Context
Advertising "wins on 1 in 3 spins!" for a game where 17 of those wins are pseudo-wins (sub-stake returns) is technically true but potentially misleading. Regulators in the UK and Netherlands are increasingly scrutinising this practice. The responsible approach: if you advertise Hit Frequency, also disclose Win Frequency or clarify what "win" means.
Mistake 5: Designing Bonus Trigger Rate in Isolation from Base Game HF
A common mistake in high-volatility game design: setting a low base game HF (15%) to create tension, and then setting a low bonus trigger rate (1 in 350 spins) for high bonus EV. The result:
350 spins × 85% non-win spins = 297 dead spins between bonuses
35 win spins between bonuses (average) — but most are tiny

Player experience between bonuses:
- Mostly losing
- Occasional tiny wins providing minimal engagement
- Waiting ~6 minutes for a bonus that might not pay much
This game fails at the session narrative level — there is no emotional arc, just a tense wait that often ends in disappointment.
The fix: ensure that even in high-volatility games, the base game provides enough "moments" (mid-tier wins, near-misses, visual interest) to sustain the narrative between bonuses. This often means HF should not go below 18% even in very high volatility designs, compensated by eliminating pseudo-wins (reducing WF as proportion of HF rather than reducing HF outright).
Part VIII. Frequency in Free Spins and Bonus Rounds
8.1 Free Spins HF and WF Differ from Base Game
Free Spins typically use enhanced reel strips with more Wild and Premium symbols. This fundamentally changes both HF and WF:
Base game HF:  30%
Free Spins HF: 42%  (more Wilds means more completions)

Base game WF:  22%
Free Spins WF: 35%  (higher payout combos appear more often)

Effective WF in FS (accounting for multiplier):
  Line win of 5× base payout with ×2.5 FS multiplier
  = 12.5× total bet → always registers as Win Frequency hit
  FS WF (effective) ≈ 38–40%
Players subjectively experience Free Spins as highly frequent wins — the enhanced strips deliver this. The feeling of "winning on every spin" during Free Spins is a deliberate design outcome, not a coincidence.
8.2 Pick Bonus Hit Frequency
In Pick Bonus rounds (player selects from symbols to reveal prizes), "Hit Frequency" is redefined:
Pick Bonus HF ≈ P(pick reveals ≥ 1× starting stake)Most Pick Bonus designs guarantee at least a minimum prize on every pick, so Pick Bonus HF approaches 100%. This is intentional — the bonus round should always feel rewarding, even when it pays close to minimum. The psychological closure of "I won something" is more important in a bonus round than in the base game.
Summary
Hit Frequency and Win Frequency are not the same thing, and treating them as interchangeable is the most common frequency-related mistake in slot development. They measure different phenomena — the former counting any non-zero event, the latter counting genuinely net-positive events — and they drive different aspects of player experience.
The key principles from this article:
Win Frequency is what players perceive as "winning." Engineer WF, not just HF. A high HF with low WF creates a game that feels rigged despite mathematically correct RTP.
The HF−WF gap (pseudo-win rate) is a regulated territory. Keep it in the 7–12% range. Significantly higher values attract regulatory scrutiny and negative player perception.
Dry spell distribution matters as much as average HF. The expected longest losing streak, not the average win rate, determines the emotional floor of the player experience. Calculate it. Report it. Design against it.
Bonus Trigger Rate and base game HF work together to create the session narrative arc. A game with low base HF needs a compensating high BTR. A game with high BTR can sustain lower base HF. Neither extreme works in isolation.
Full enumeration is the only reliable way to compute HF and WF. Formula-based approximations that ignore payline correlation overstate HF by 3–8% — enough to create a meaningful mismatch between the PAR Sheet and player experience.
Report both HF and WF in your PAR Sheet. Some jurisdictions now require it, and all jurisdictions are moving in that direction. Getting ahead of the requirement is good practice.